Changes in terrestrial water storage in Germany
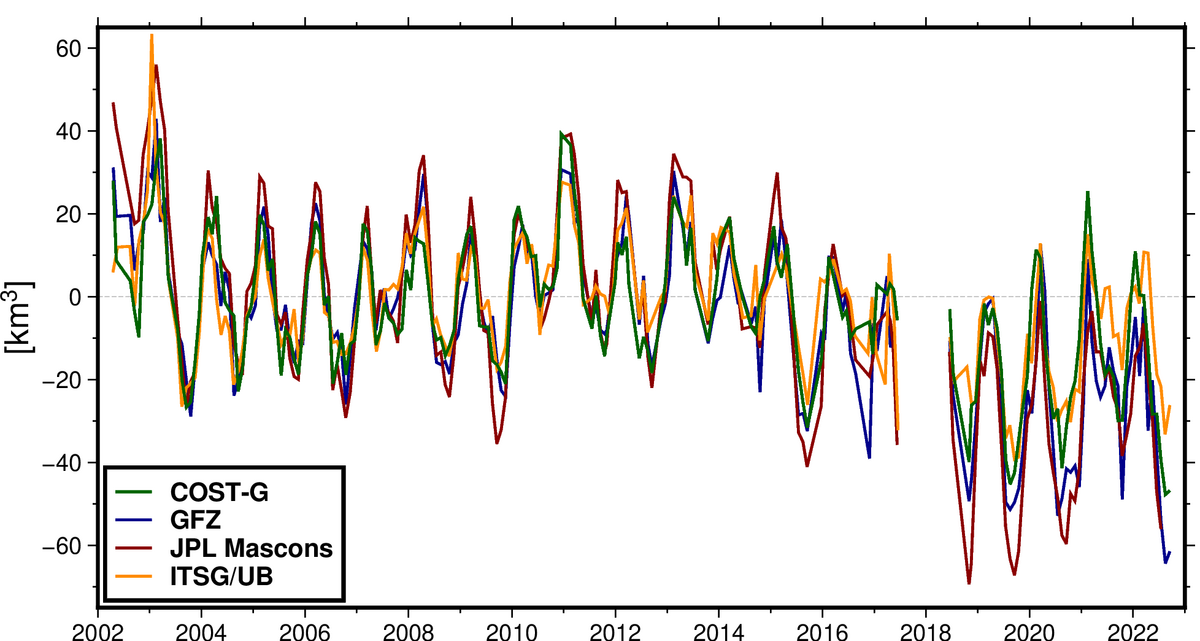
Studies including the available GRACE and GRACE-FO time series have shown that in Germany terrestrial water storage (TWS) has decreased by a total of 15.2 cubic kilometres over the approximately 20-year observation period since 2002 (see graph on time series below). For comparison: water consumption of industry, agriculture and private households in Germany is around 20 cubic kilometres per year. However, the decrease is not uniformly distributed in time. In the TWS time series for Germany, the clearest pattern is the seasonal fluctuation in water storage with the highest values at the end of winter after several months with high precipitation and low evaporation. The lowest values of water storage in the year occur at the end of summer after higher temperatures lead to more evaporation. These seasonal fluctuations amount to about 40 cubic kilometres, so they are greater in quantity than the long-term decrease.
Spatial resolution of the GRACE satellites
With GRACE and GRACE-FO precise statements can be made about changes in terrestrial water storage of the entire Earth. However, regional changes can also be observed, given a large enough region of interest. The spatial resolution of the method is approximately 300 x 300 kilometres. Accordingly, reliable statements can be made for areas of around 100,000 km² which corresponds roughly to the combined size of Bavaria and Baden-Württemberg. However, due to the technology involved in satellite gravimetry observed gravimetric changes cannot be traced back to individual areas or object on Earth as clearly as can be done e.g. with a classic satellite image. Accordingly, observed areas and objects cannot be delimited precisely. For Germany, for example, the effect on the gravity field caused by the melting Alpine glaciers located in Austria, Switzerland and France overlays the measurements of water storage in the Alpine foothills. These effects must be taken into account and corrected.
Hydrological extreme events
Extreme hydro-meteorological events can be made visible with the help of the data on terrestrial water storage changes in Germany. The year 2002 was characterized by very high precipitation and several flood events, especially in southern and eastern Germany, and stands out with the highest TWS values in the entire observation period. This period was followed by the very hot summer of 2003, which led to a relatively strong decline in water storage due to high evaporation rates. Following a period of rather stable conditions TWS in Germany started to gradually decline from 2015 onwards. After a sequence of dry years water storage reached its lowest values in the observation period in the late summer of 2018, 2019 and 2022. The observations show that an intermediate year with higher precipitation, such as 2021, is not sufficient to make up for the deficits in water storage that have accumulated over a long period.
Flooding after extreme weather: The Ahr Valley flood
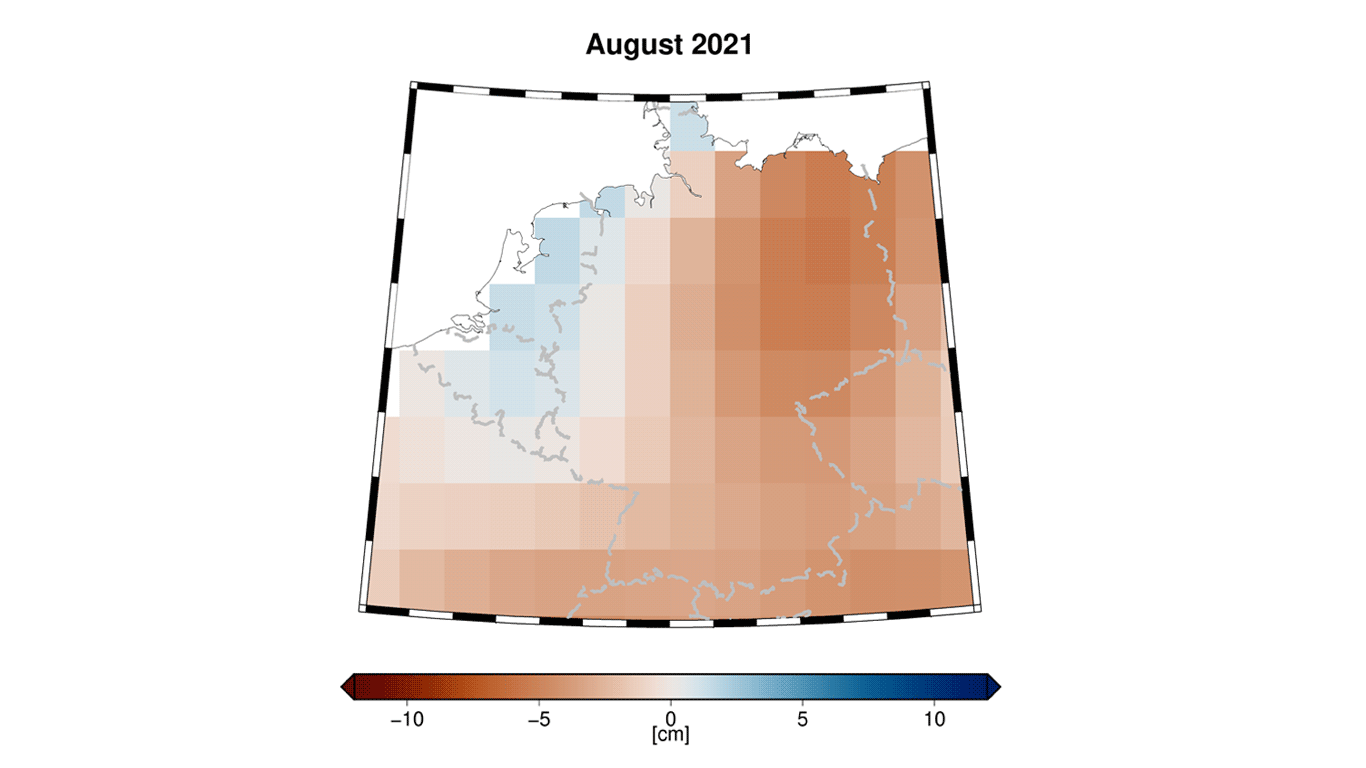
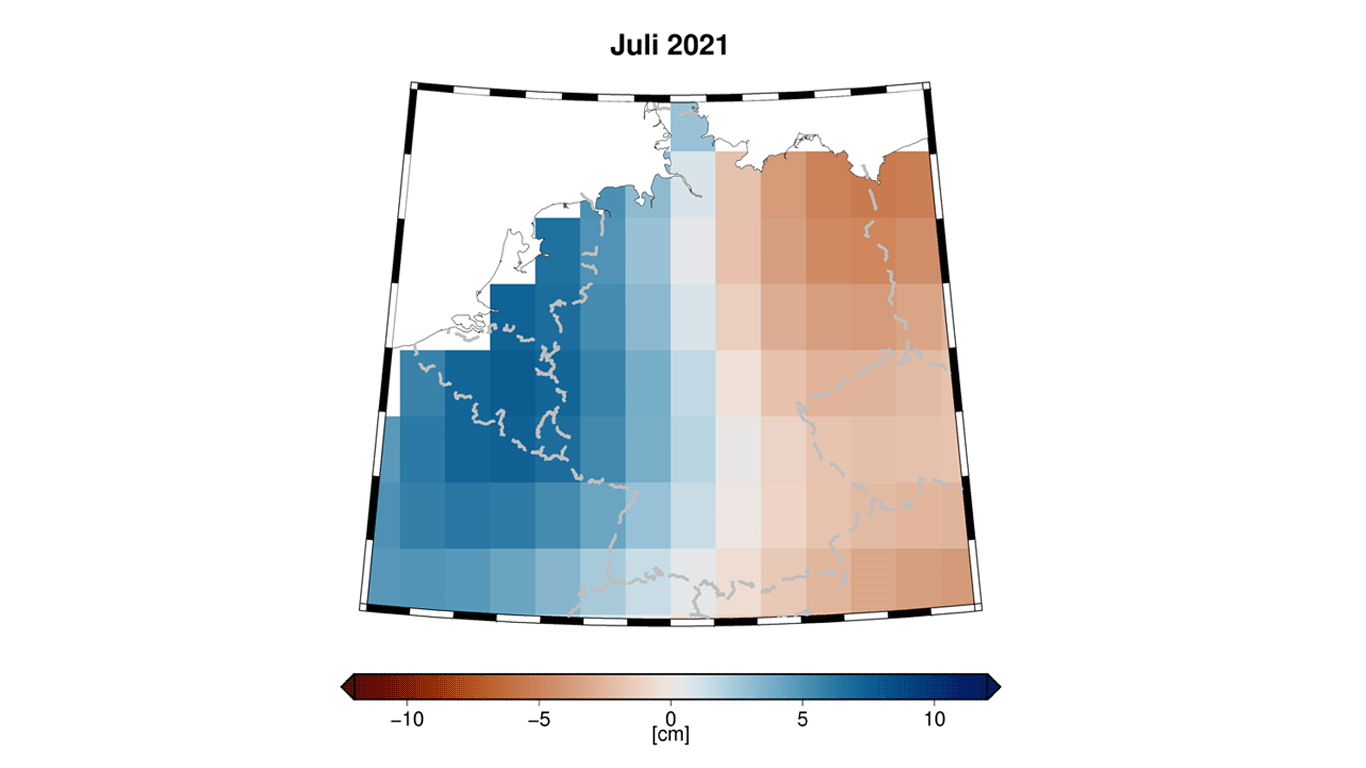
The two maps from the summer of 2021 use GRACE-FO data to show the deviations in terrestrial water storage for Germany. In July 2021, a heavy rainfall area moved across western Germany and the neighbouring states, causing a flood disaster. On the map for July, we see a sharp increase (blue) in terrestrial water storage. This is mainly due to the oversaturated soils caused by the heavy rainfall. In August, the terrestrial water storage also decreased significantly again after most of the precipitation had run off on the surface and the soil had time to dry out.
Maps: Eva Boergens, GFZ
Long-term trends

Diagramm: GFZ
Over the 20-year observation period water storage in Germany decreased by an average of 760 million cubic metres per year. However, this value can vary depending on which GRACE data product you look at: The results of different processing centres of GRACE data differ from each other and indicate that the observations and their evaluations are subject to uncertainties. These uncertainties must be taken into account in the interpretation. Furthermore, some striking extremes occurred during the twenty years of data collection so far, including a particularly strong positive anomaly of water storage at the beginning of the time series and rather large negative anomalies at the end of the observation period. These events influence the trend estimate so that only limited statements on future trends can be made. The 20-year observation period to date is still too short to be able to derive a long-term trend with less uncertainty.
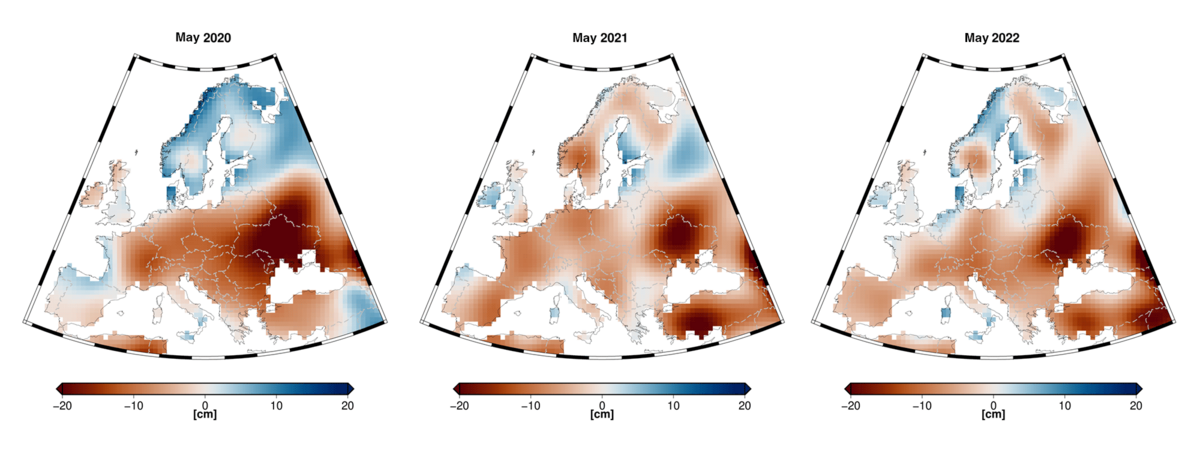
The GRACE and GRACE-FO data also show the impact of the low precipitation years from 2018 onwards in the rest of Europe. The spatial patterns of water storage deficits in Europe differ in the individual drought years. However, there is an overall widespread decline in water storage over the observation period. Differences of the spatial patterns to the patterns in other drought indicators, such as indicators based on soil moisture, also proof that the additional information gathered by GRACE/ GRACE-FO enable us to see the dynamic in deeper soil layers and in groundwater.
Text: Prof. Dr. Andreas Güntner, GFZ & Dr. Julian Haas, GFZ
Observing water shortages in Europe

Since 2018, most summers in Europe have been too dry. This led to significant groundwater deficits in many areas. The maps show the regions of Europe in which terrestrial water storage (TWS) shows a deficit in May. The situation in Ukraine is most striking but large parts of Germany have also been affected by drought and water shortages for several years now.
Further Information
- Germany lost an average of 760 mio tons of water per year over the last two decades Press release GeoForschungsZentrum Potdam
- Regen reicht nicht aus: Deutschland hat 15,2 Milliarden Tonnen Wasser verloren. Frankfurter Rundschau, 18.8.2023 (only in german)


