Picture of the month
Long-term trend of terrestrial water storage

Map visualisation: Antonia Cozacu, GFZ
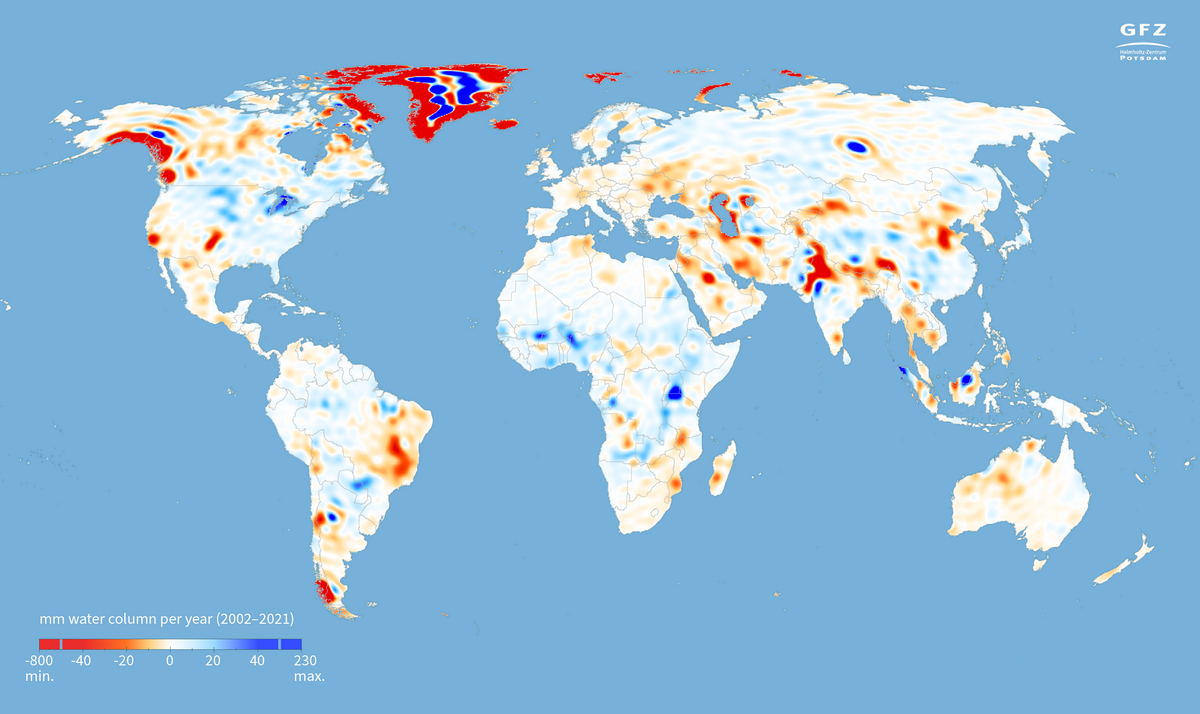
Terrestrial water storage 2002–2021
The map shows the trend of terrestrial water storage (TWS) over the period 2002 to 2021, i.e. over 20 years. Trend are particularly good for highlighting processes that have long-term impacts. Negative trends, i.e. losses in total water storage over the observation period, are coloured red. Positive trends, i.e. areas in which total water storage has increased, are coloured blue.
For example, in the northwest of North America along the Alaskan coast, or in the south of South America in Patagonia, we see the loss of water due to glacier melt. In northeastern China, along Bohai Bay and the Yellow Sea, or in northern India, we see negative trends that we know are related to long-tern overuse of groundwater for irrigation. With GRACE/GRACE-FO, it is now possible for the first time to quantify the full extent of this groundwater overuse from space.
In the southern half of Africa, on the other hand, we see a clearly blue-coloured area where Lake Victoria is located. This positive trend comes from the fact that over the observation period the lake's water level has recovered from a historic low in the early 2000s.
Note: Due to the strong distortion in the projection of the world map, Antarctica has been omitted here. A trend map for Antarctica with increases and decreases in water storage will be published next month as "Picture of the Month".
(Source of data: Kvas et. al, 2023)
Image
You may use the map by stating the copyright.
Download the map via the media library