Picture of the month - December
Loss of ice mass in West Antarctica
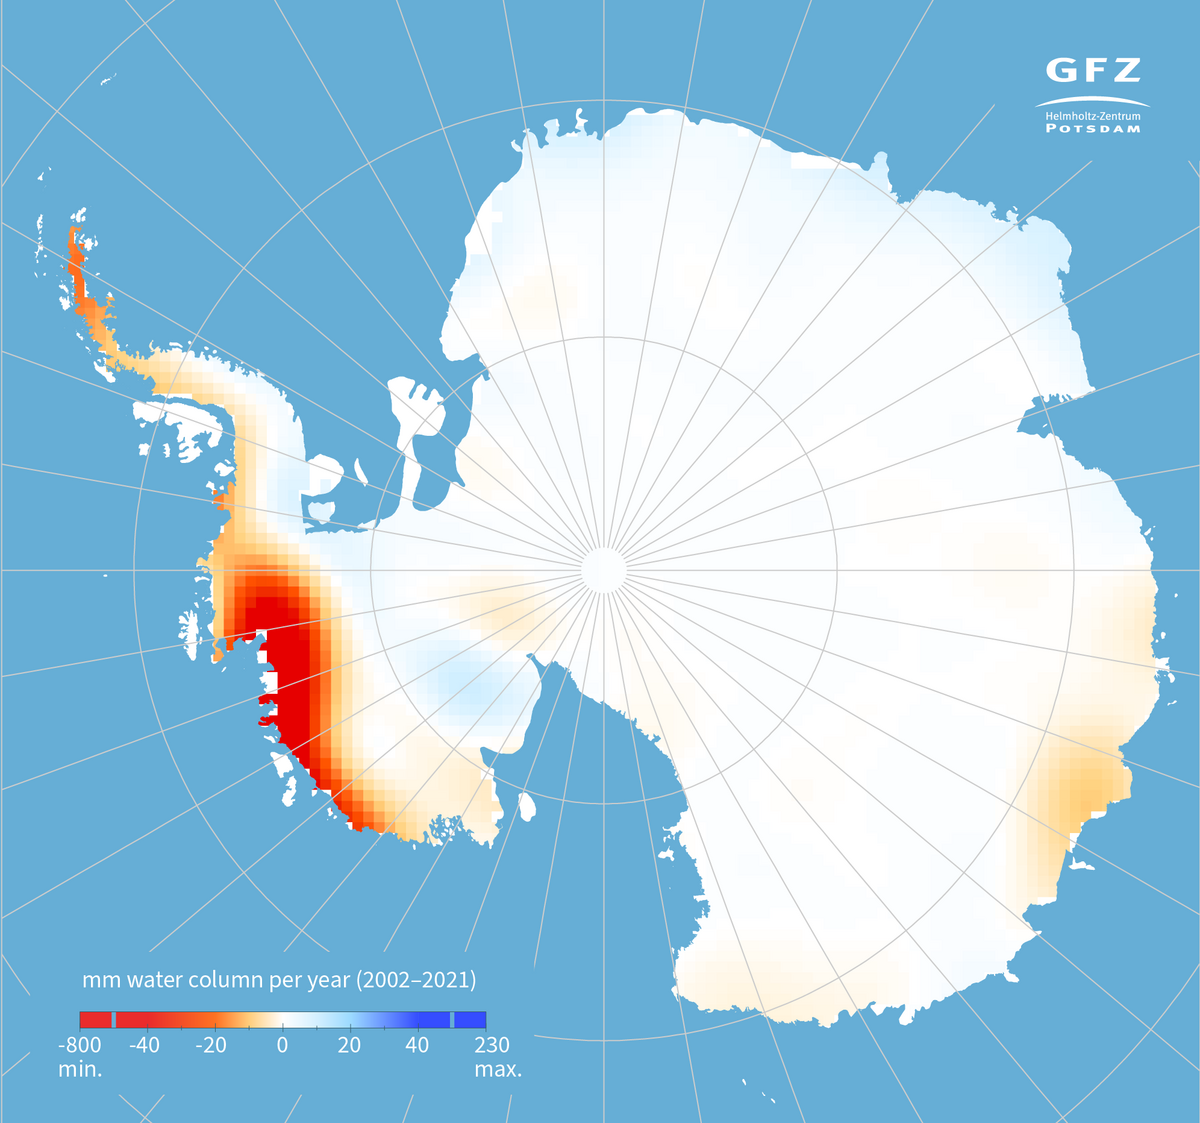
The map of the month for December shows the temporal trend in terrestrial water storage (TWS) in Antarctica over the period 2002 to 2021, i.e. over 20 years. Due to the very low surface temperatures throughout the year, water in the polar regions is predominantly in a frozen state, meaning that all changes in water storage as observed by the GRACE satellites result from variations in the total mass of continental ice. The red colour indicates negative trends, i.e. losses of ice during the observation period. Positive trends are coloured blue, i.e. areas in which the ice mass has increased due to exceptionally heavy snowfall, for example.
Particularly strong ice mass losses are detected in the West Anarctic (Ellsworth Land, Marie Byrd Land). Glacier systems located there, such as the Thwaites Glacier, are currently losing more and more mass. The northern tip of the southernmost continent, the Antarctic Peninsula, is also affected by ice mass loss. A (slight) increase in ice mass is only recorded in very few regions, for example along the coast of East Antarctica or in the area of the Transantarctic Mountains south of the Ross Sea. Large parts of central Antarctica are currently stable. However, should observational data from GRACE-FO also show a loss of mass here in the future, a drastic rise in global sea levels would be foreseeable.
(Source of data: Kvas et. al, 2023)
Read more about the loss of ice mass in Antarctica on the focus page “Ice sheets”
Image
You may use the map by stating the copyright.
Download the map via the media library
