Picture of the Month - March
Animation: Change in terrestrial water storage for Europe
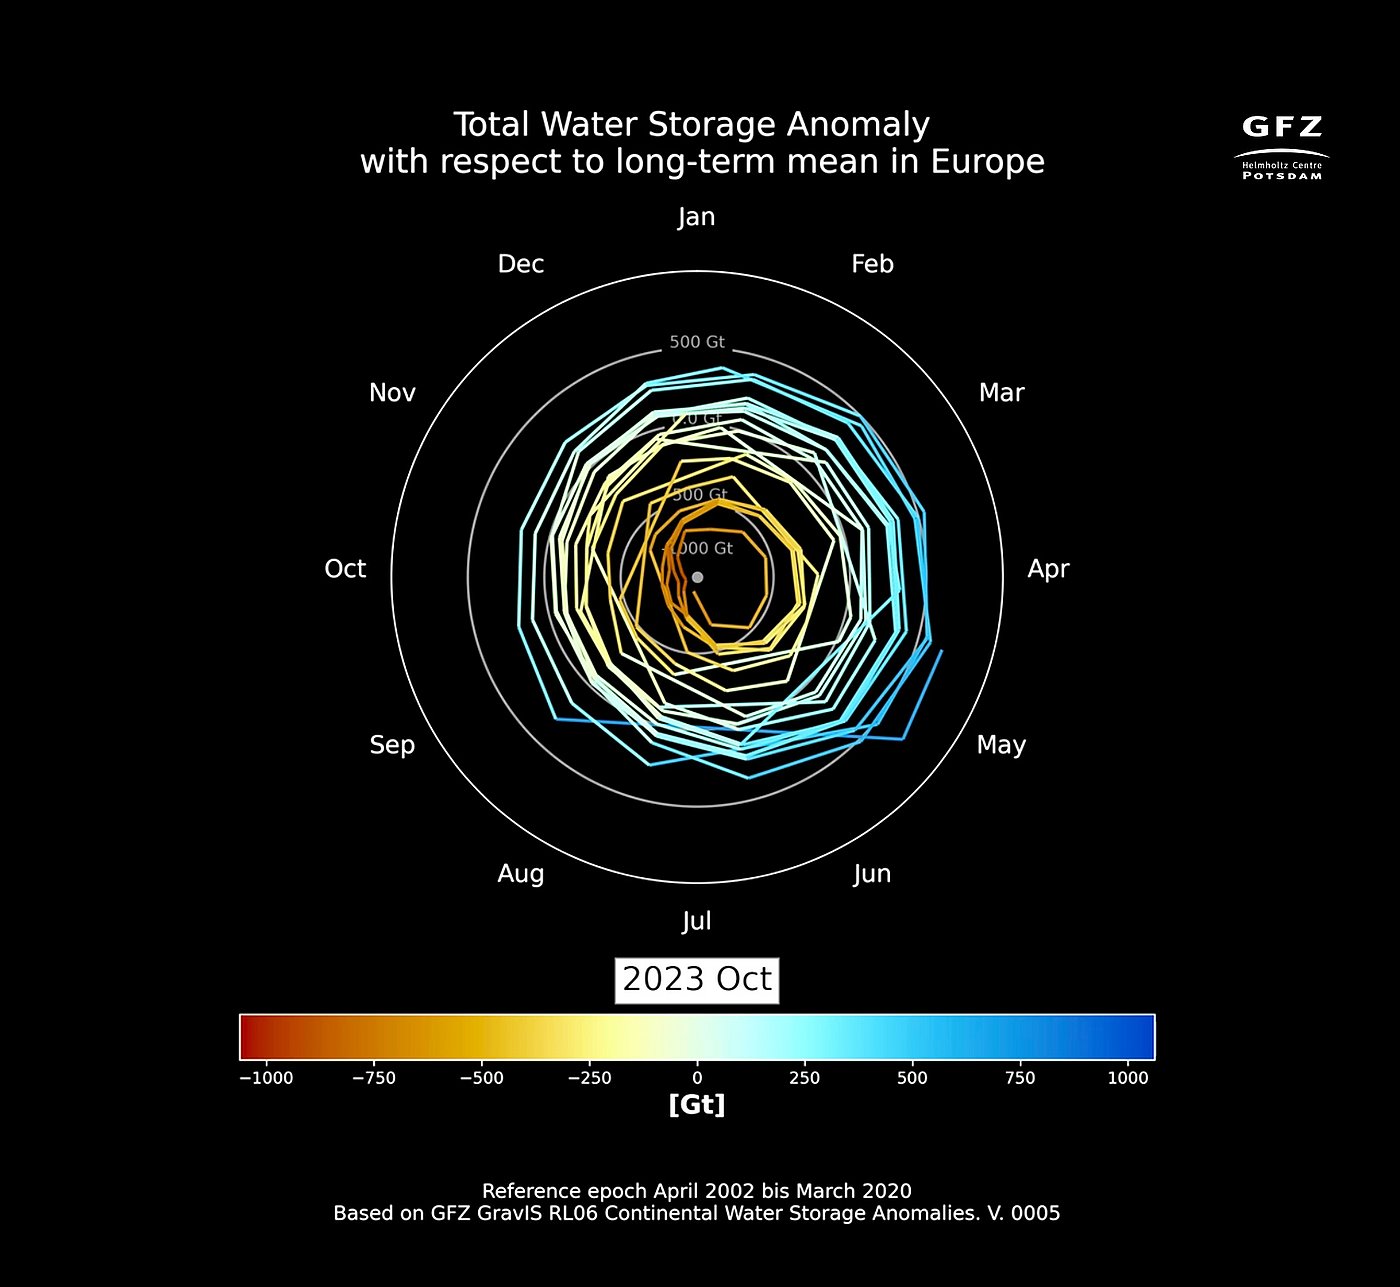
The animation shows the changes in terrestrial water storage (compared to the long-term average) for Europe in the period from April 2002 to October 2023. The further out the line runs, the more water was stored at that time. After several more or less stable years, water loss has increased significantly in recent years.
Recommended reading
- Background information: Focus page terrestrial water storage
- Article “Changes in terrestrial water storage in Germany”
Change in terrestrial water storage over the long-term average in Europe
Download
You may use the map by stating the copyright.
Download the map via the media library