Picture of the month - December
Ice mass loss in Greenland

Eva Boergens, GFZ
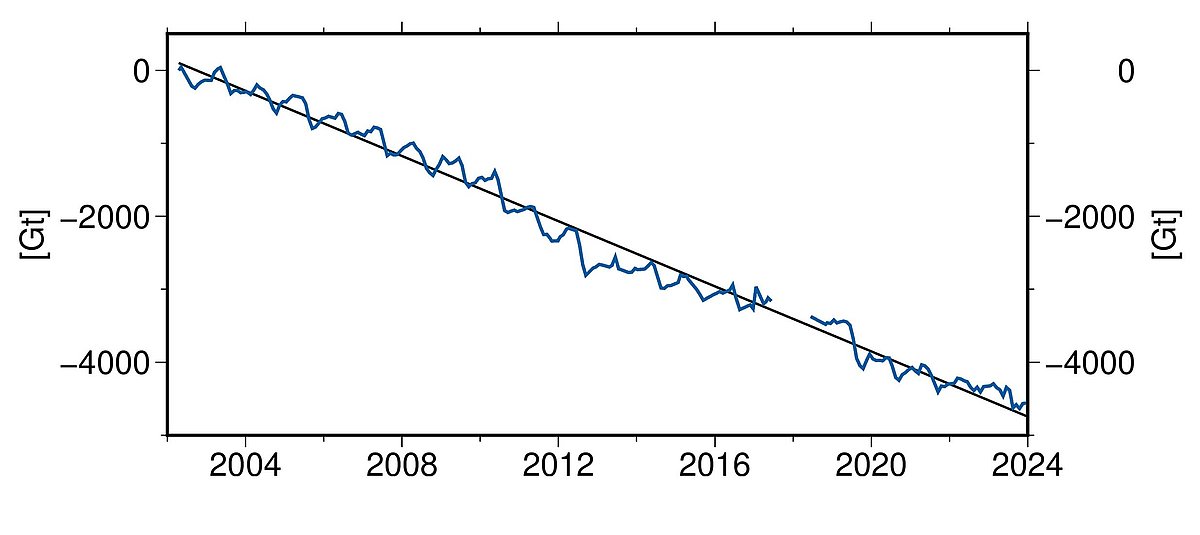
Since 2002, the Greenland ice sheet has lost around 225 Gigatons per year of ice mass. One Gigaton of water is equivalent to a water cube with an edge length of 1 kilometre. The melting water of the ice masses contributes to a 0.6 mm sea level rise yearly, or nearly 14 mm, since 2002.
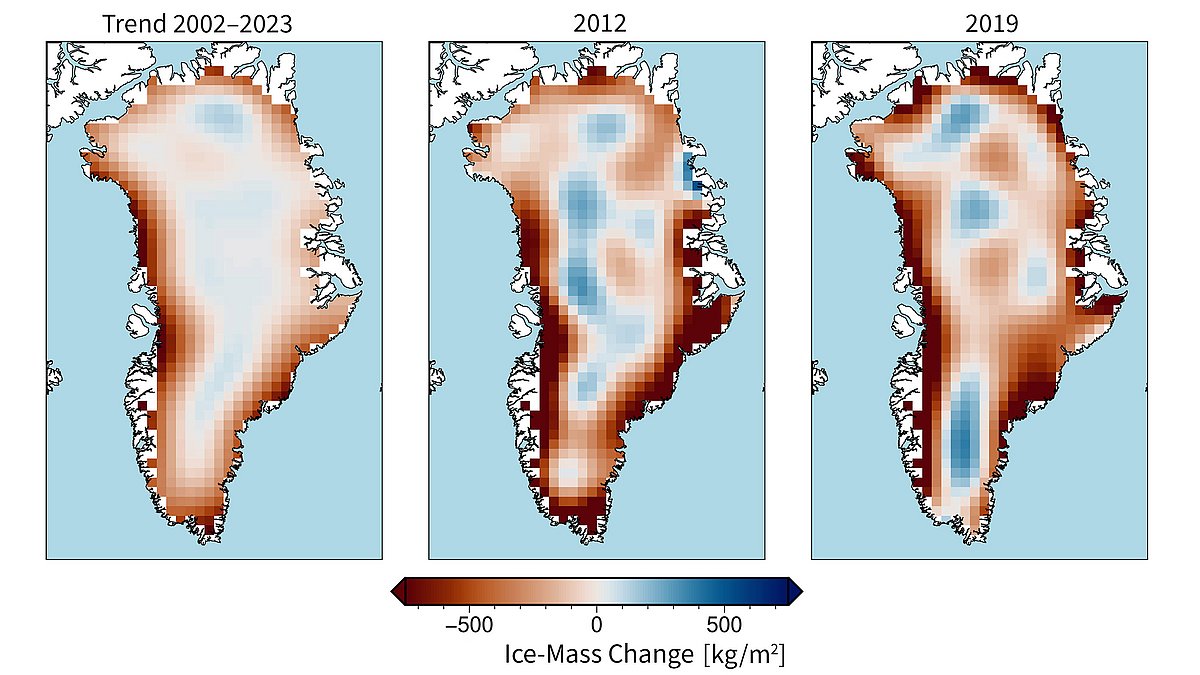
However, not all regions are similarly affected by this thawing process. While the interior of the ice sheet is slightly gaining ice masses, the most considerable mass losses are along the Western coast of Greenland and the South-Eastern coast.
Further, the melting of ice varies over time. During the winter, ice masses accumulate in Greenland that melt during the summer. However, the amount of the yearly ice accumulation and melting varies. Since 2002, two years stick out with notably severe melting events during the summer. In 2012, the ice mass loss amounted to 410 Gt; in 2019, even 500 Gt of ice mass melted. Also, between 2012 and 2019, the spatial pattern of the melting changed. On the one hand, in 2012, the Northern coast of Greenland was less affected by ice mass loss than in 2019. On the other hand, the South-Eastern coast saw more ice melting in 2012 than in 2019.
Text & Maps: Eva Boergens, GFZ
Download
You may use the graphic by stating the copyright.
Download the graphic via the media library
Reading tip
- Focus page Ice: Mass balance of continental ice sheets
